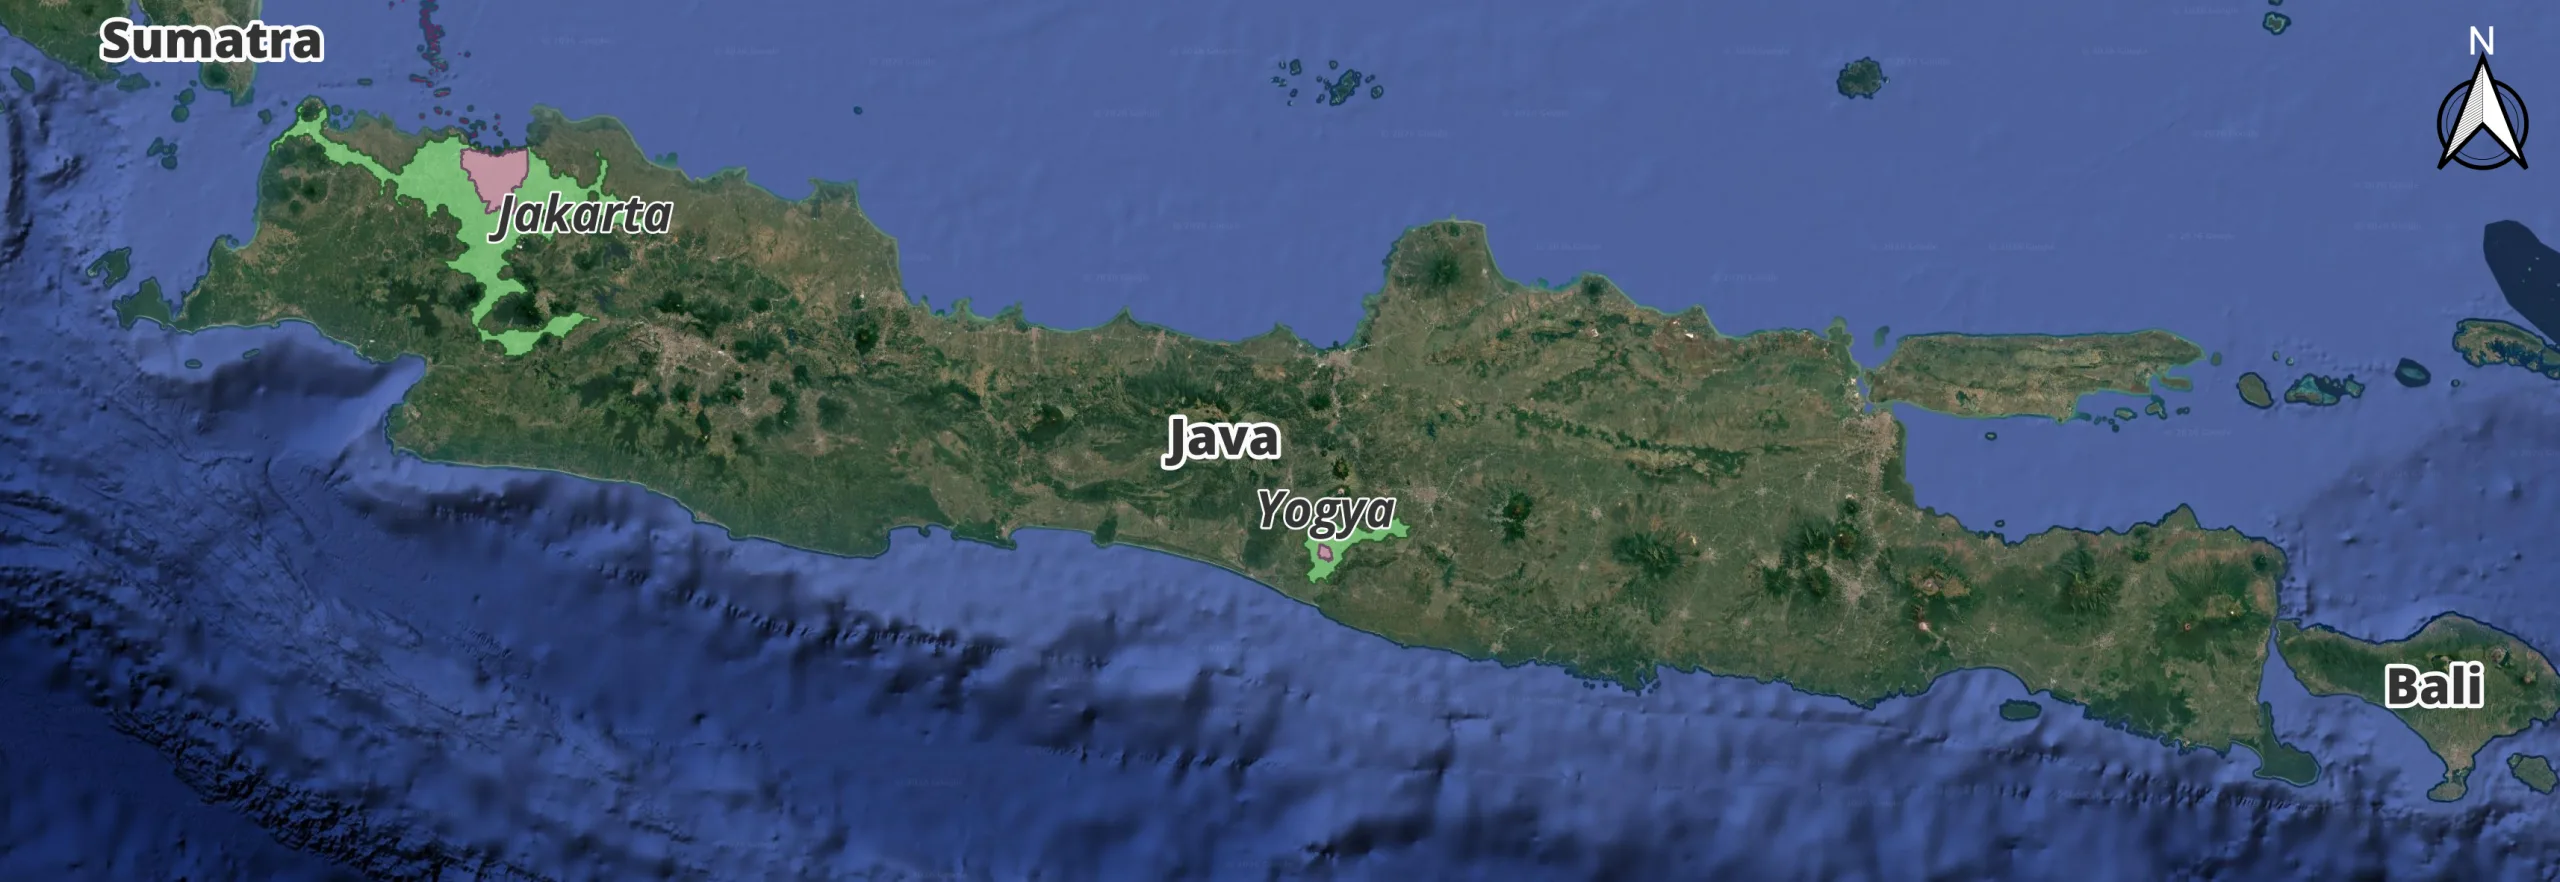
Until November 2025, Jakarta was the 33rd most populous city in the world. You might be wondering how Jakarta all of a sudden leapfrogged 32 countries to become the top population city in the world. Like so many things in life, it comes down to definitions. There is no universal definition for “city”, so traditionally governments around the world have used some sort of legal administrative boundary and an existing census. This is convenient, but can massively over and under represent the congregation of people, and is usually inconsistent between countries. A single larger urban area can be broken into pieces (e.g. Dallas and Fort Worth, TX USA), while in another area a single city can span a major river as a single city (e.g. Budapest, Hungary spans the Danube). In most of Indonesia, the administrative boundaries used until 2025 represented only the old urban cores, and ignored decades of growth.
To address these issues, in 2025 the UN shifted to an entirely new approach. They..
- ..created a global grid of 1 km x 1 km cells (and no, an irregular ellipsoid like the Earth doesn’t easily turn into a nice collection of flat squares but that’s another story). These are arbitrary but static.
- ..used satellite imagery to estimate building counts and heights.
- ..reallocated the census population to the cells and used it to calibrate the building-based estimates.
- ..clustered touching cells above a certain population density into cities.
The result is a very organic looking map that can be reproduced anywhere in the world and at any point in time. In fact, they have published the cell-based population statistics forward and backward in time from 1975 to 2100.
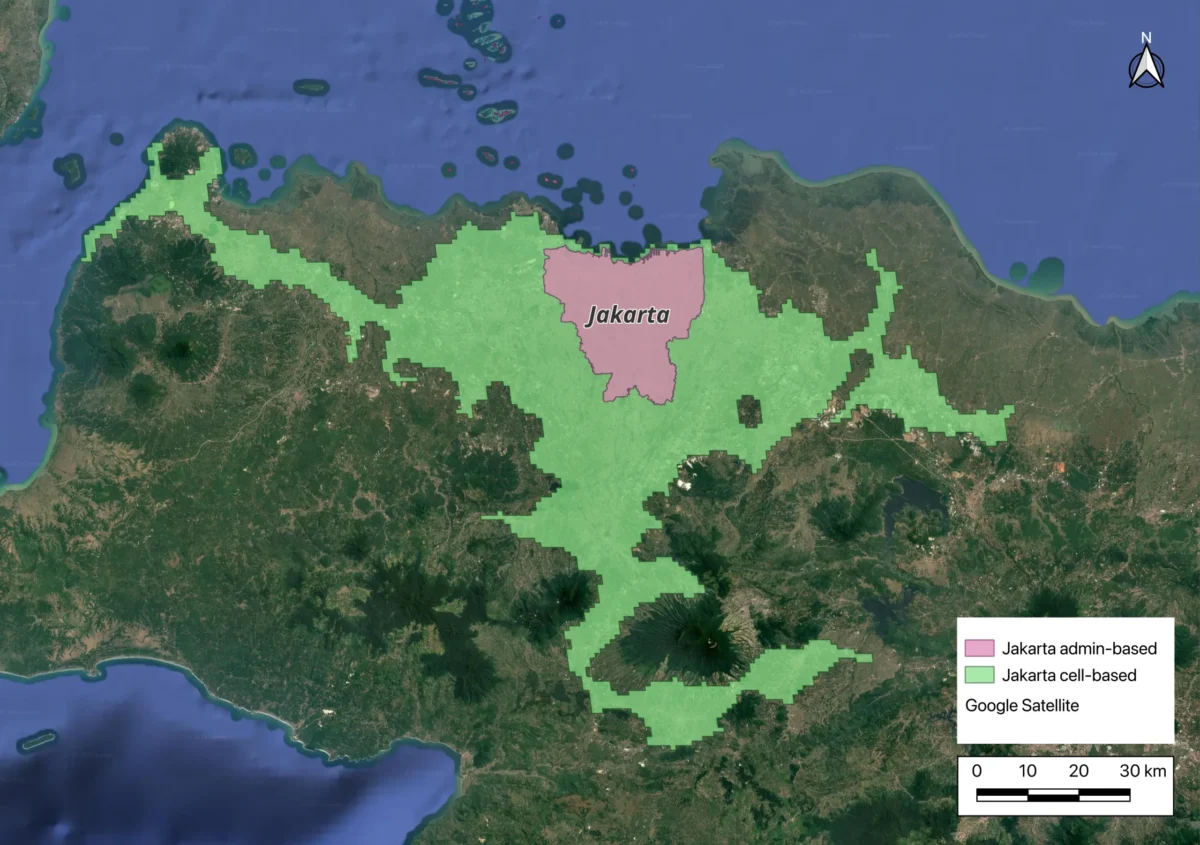
As a result of this change in methodology, Jakarta’s area rose from 654 sq km to 4,883 sq km (~7.5X) and its official population leapt from ~11 million to ~42 million (~3.8X) overnight without a single person coming or going.
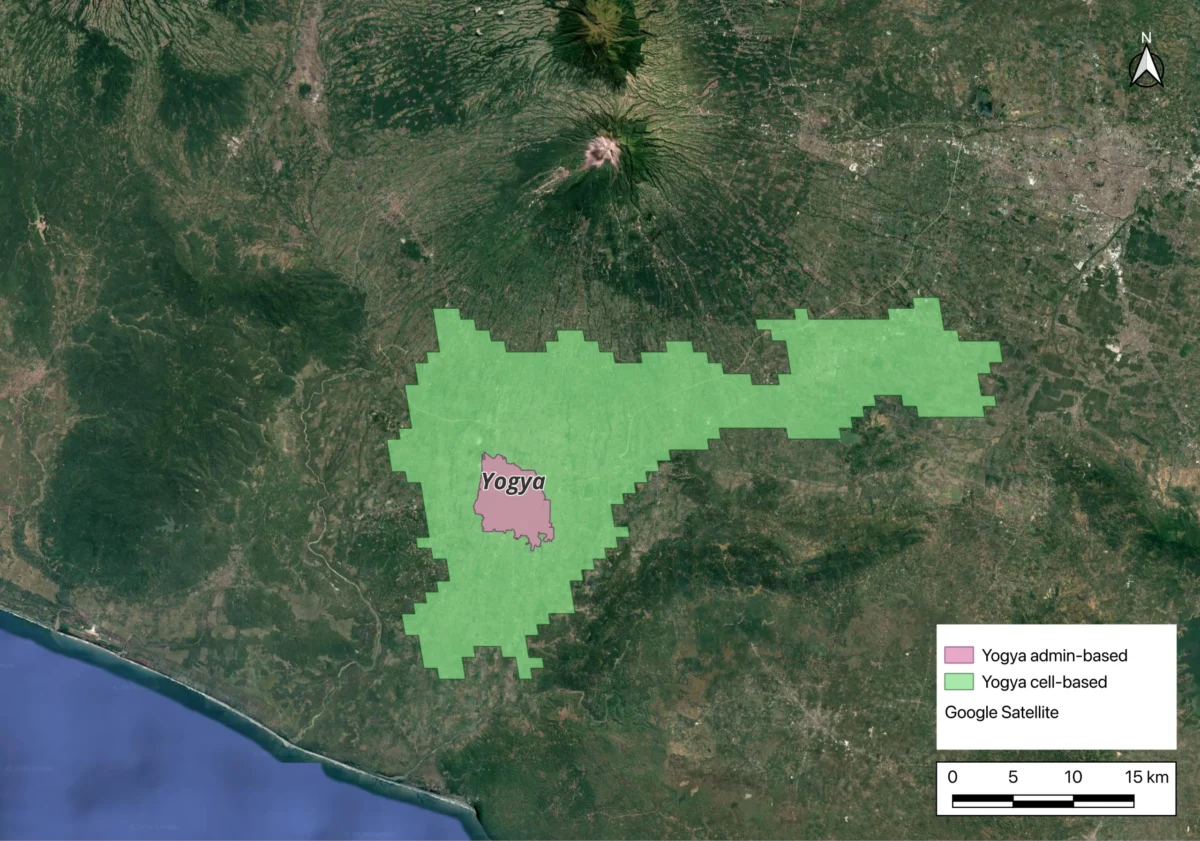
Percentage-wise the change was even greater for Yogya. The area rose from 33 sq km to 653 sq km (~19.8X) while the estimated headcount exploded from ~375 thousand to ~2.8 million (~7.5X).
It seems inevitable based on the interpolation and extrapolation techniques used that the new population figures are inaccurate. However by applying the same rules everywhere and steering clear of political pitfalls like gerrymandering, I think the new approach gives a better measure of how big each city “feels”. This new method generates a type of “built-up area”, which is a popular concept in map data amongst the big mapping companies.
Sources: Schiavina, Marcello; Alessandrini, Alfredo; Melchiorri,Michele; Dijkstra, Lewis (2026): GHS-WUP-MTUC R2025A – GHS-WUP multitemporal urban centres, obtained from the Degree of Urbanisation grids (GHS-WUP-DEGURBA R2025A) and linked across epochs, multitemporal (1950-2100). European Commission, Joint Research Centre [Dataset] doi: 10.2905/JRC.7R7GN88; 10.2905/1ea967e5-bedc-4cf3-a0b0-3851742ee7e2 PID: http://data.europa.eu/89h/1ea967e5-bedc-4cf3-a0b0-3851742ee7e2; Google; geoLab @ William & Mary